STUFF FOR
HUMANS
Why Marketing Analytics Differ by Source
“I got your report, but I noticed clicks to site from Facebook didn’t match unique visits from Facebook in Google Analytics.”
-YOUR BOSS
KEY TAKEAWAY: Mitigate the insignificant differences in multiple data sources, such as a small +/- difference in page views, and embrace the diverse perspectives that multiple data sources can bring to your reports.
Early in my career, I remember handing over Google Analytics reports to my clients. I was a web product manager, and one of my jobs was to show how our marketing efforts impacted site traffic. But I would get questions about why certain metrics didn’t match up. Not just from my clients, but from the media buyers and account managers. I would answer with “I’m not sure, let me look into it, but if you’ll turn to page three…” and secretly hope that we wouldn’t revisit the topic. The focus of those reports was on small differences in data points that didn’t matter all that much.
Still, in the current reporting landscape, marketing reports often
lack clarity. They lead to questions about the integrity of the data and less
no questions about the marketing efforts. So, why this problem? Why do metrics
not always line up? How much time should you spend fixing the issue?
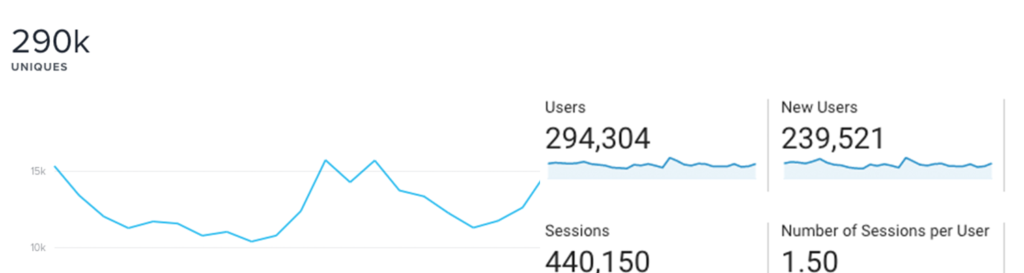
When you start doing some digging to answer these questions, you’ll find one of the latest trends in marketing is identifying your single source of truth for reporting. That makes sense, right? You would rather find one source of data truth and trust it. In these screenshots, you can see page views to a website as reported by Quantcast and Google Analytics. With a single-source mindset, you would eliminate Quantcast from your reporting eco-system and allow the Google Analytics report to hold the number of visits to your site. It’s not wrong as those are small differences that you should remove from your report, but you can go too far.
Data sources are like people. Each source of data offers a different perspective. The more perspective you bring to your team, the better your end product will be. Marketers can spend too much time trying to map the micro-differences of less important data points to keep from distracting from a larger story. So, it’s tempting to move to a single source of reporting truth, but there’s a tremendous amount of lost perspective that can prove valuable in analysis, forecasting, and planning. Sticking with our same channel examples, post sentiment based on reaction types, content quality based on engagement rate and spend efficiency based on cost per acquisition are just a few examples of what you can use by keeping Facebook as a data source.
UNDERSTANDING CHANNEL IMPACT
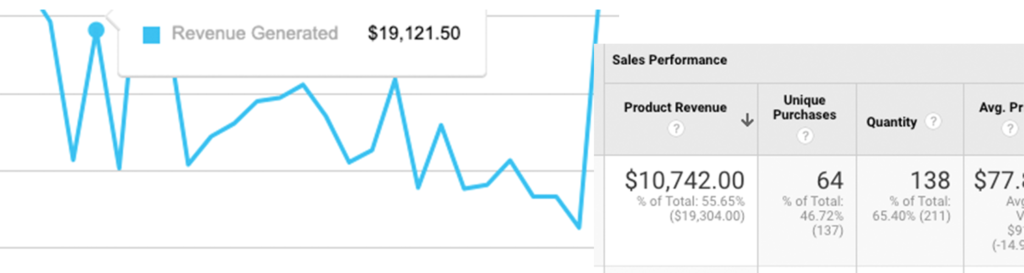
Perhaps the worst collateral damage from a single source reporting model is the loss of a true look at attribution. Publishers all report on attribution with slight variations, and Google Analytics still uses last touch attribution out of the box. Here are a few more screenshots from Facebook and Google Analytics. Same time periods, way different revenue numbers. If you’re familiar with Google Analytics and Quancast, you’ll know that the difference is attribution. Quantcast has a default attribution window of seven days, while Google Analytics has Last Click as its default attribution model. Attributed revenue is extremely important. Display ads drive a low last click conversion rate, but it’s very common for users to come back to make a purchase through another channel such as organic search.
The entertainment venues we work with are a great example of this pattern. We’ve found that users will click on display ads, get prices for a show, but then they have to check with their friends to see if everyone wants to go. Once they are ready to purchase, they go to Google and search for the concert and venue. So, our insights team makes the recommendation to run search campaigns to ensure our clients capture that traffic instead of a competing site.
If we relied on one source, Google Analytics, it would have shown paid search ads driving impressive revenue and Facebook ads driving very little. So, naturally, a marketer might say “let’s cut Quantcast’s spend and allocate the dollars to Google Ads.” By adding a second data source, and considering Quantcast’s perspective, we are able to observe it drove the top of the funnel and was one of the early touchpoints in the consumer’s path to purchase. It’s likely that the chances of a conversion decrease without the first touch by the Quantcast ad.
Attribution is just one of the many diverse perspectives that different data sources can bring to your reports. Don’t listen to the hype. You don’t need one single source of truth in your marketing efforts. You need a diverse, and transparent, look at multiple data narratives to compile your reporting story.


